August 15, 2018
Are you a business owner using QuickBooks Online for your bookkeeping and are unsure how to interpret the Profit & Loss Report beyond the “bottom line”?
Yes, of course, you want to know if your business is making a PROFIT (+ number at the bottom) or LOSS (- number at the bottom), but what else should you be looking for? Even if you are using the services of a professional Bookkeeper or Accountant, it can be difficult to get some meaning from numbers on a page.
I’m going to show you a few tricks from an Accountant’s perspective for how to read your QuickBooks Online Profit & Loss Report!
How To Find the Profit & Loss Report in QBO
First, you must run the report! Sign in to QuickBooks Online (QBO) and navigate to Reports on the left-hand menu. The new reports format should have Profit and Loss as a default in the Favourites section at the top, but if you don’t see it there you can type it in the search bar.
How to Filter the Profit and Loss Report in QBO
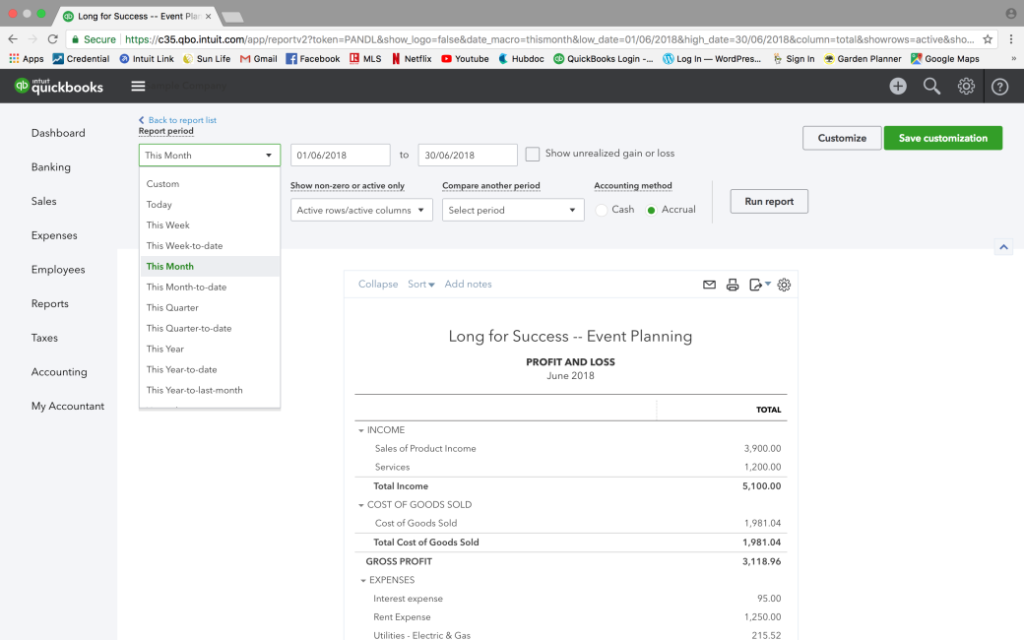
There are MANY ways to filter this report and different filters can be useful to inspect different types of information. First, select the time period that you want to review in the Report Period drop down box. Click Run report.
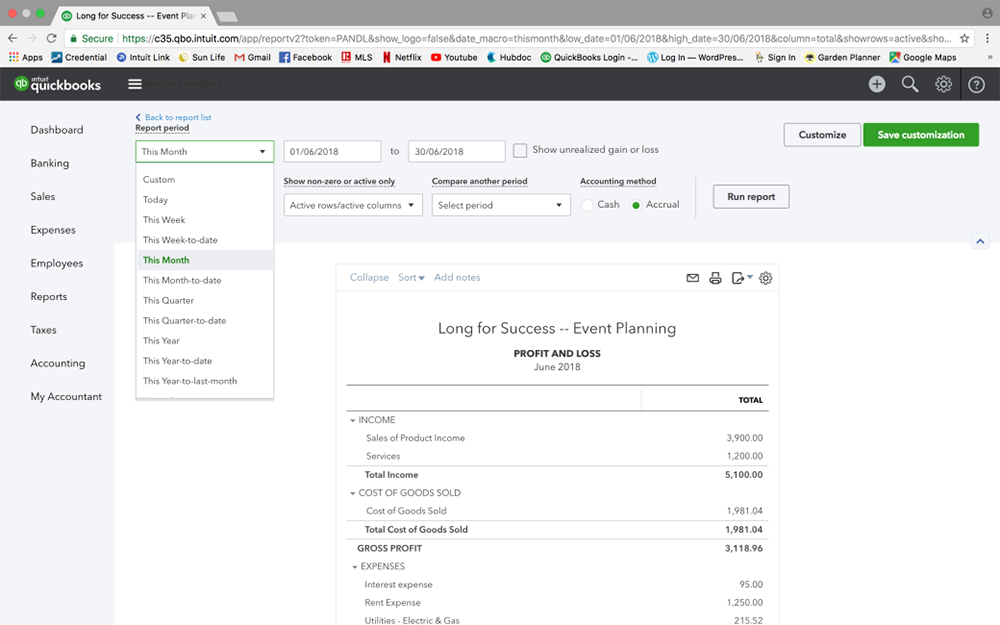
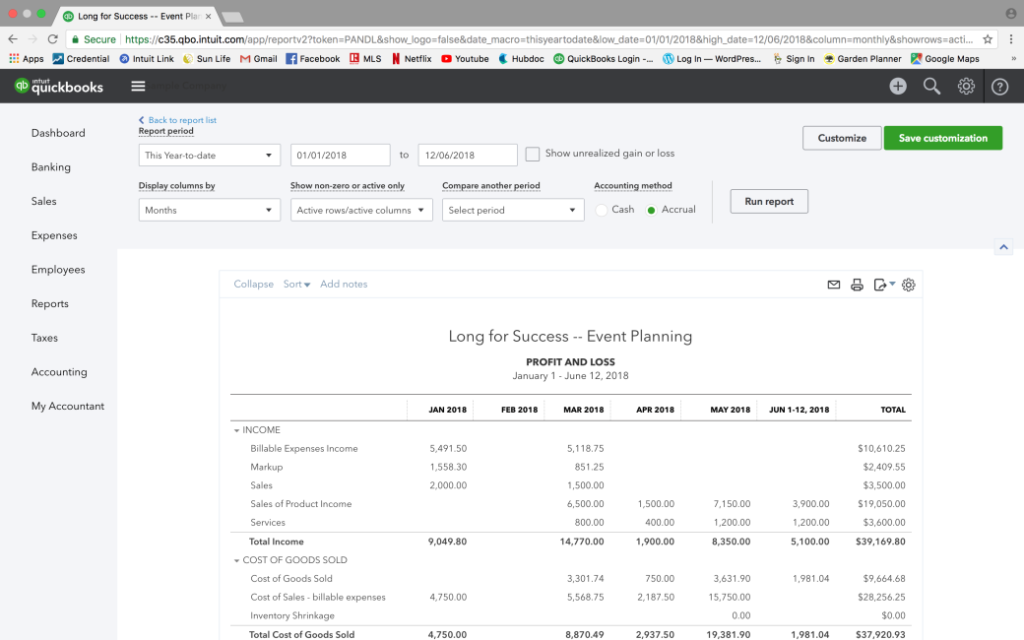
One of my favourite filters is This Year-to-Date with a filter to Display columns by Months (drop down menu below the report period menu). Click Run report. We’ll talk about how to analyze this in a second. Let’s continue with other filters for now.
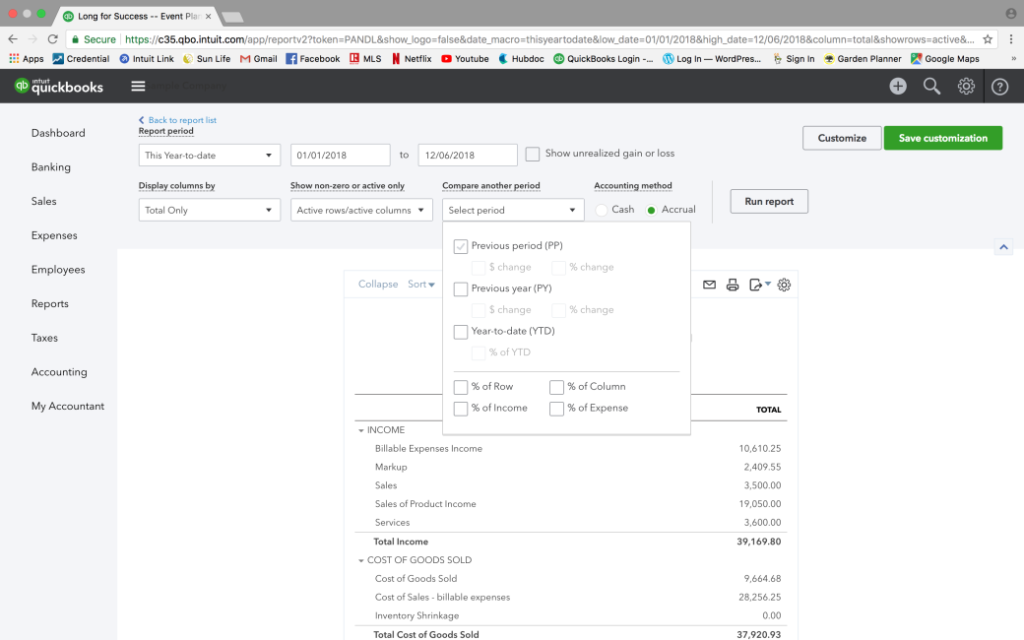
Another favourite filter of mine is to compare to a previous year or previous period. This is great if you are a few years in to running your business and have all the data in QBO! For this one, leave the Display Columns By filter on Total Only and change the Compare Another Period filter to select either the Previous Period or Previous Year. If I am looking at April 30 – June 30 of 2018 and I select Previous Period, I will be comparing this time period to the previous quarter Jan 1 – Mar 31 of 2018. If I select Previous Year, I will be comparing it to April 30 – June 30 of 2017.
How to Analyze the Profit and Loss Report Over Time
Now that you have filtered to the period of time you want to analyze, ask yourself the following questions:
- Sales going up or down over time? If there is a point in time where it looks like there was steady movement up or down, what changed at that time?
- Is there a certain time of year when Sales were higher? What was happening during that time? Perhaps your business has seasonal trends such as Christmas shopping or a busy summer season. Capitalize on those busy seasons by running a promotion or event during those times.
- What are the bestselling items?Hopefully you have set up the Products & Services List to track sales in different Income categories. You can use this information to target advertising for your bestselling items!
- What items have consistently low sales. Consider if it is worth scrapping those items or adjusting the pricing.
- Are the overall Expenses increasing, decreasing, or stable? If your expenses are increasing faster than your Sales you have a problem with either incorrect pricing on Sales or overspending on Expenses. Many business owners focus their energy on increasing profit by increasing sales, but remember that another way to increase profit is to decrease expenses! Try to set budgets and monitor your spending on non-essentials.
How to Analyze the Profit and Loss by Variable and Fixed Costs
Next up is a bit of Cost Accounting! Don’t worry, we’ll be here to walk you through it.
Variable Costs increase when Sales increase and decrease when Sales decrease. Examples of Variable Costs are Job Materials (also called Purchases), Cost of Goods Sold (Inventory Cost), and Subcontractor or Employee Wages (only to the extent that your business would need to hire more people as Sales increase).
Fixed Costs are relatively the same every month or year and are not affected by Sales trends. Examples of Fixed Costs are Insurance, Accounting & Legal, Rent, and Utilities.
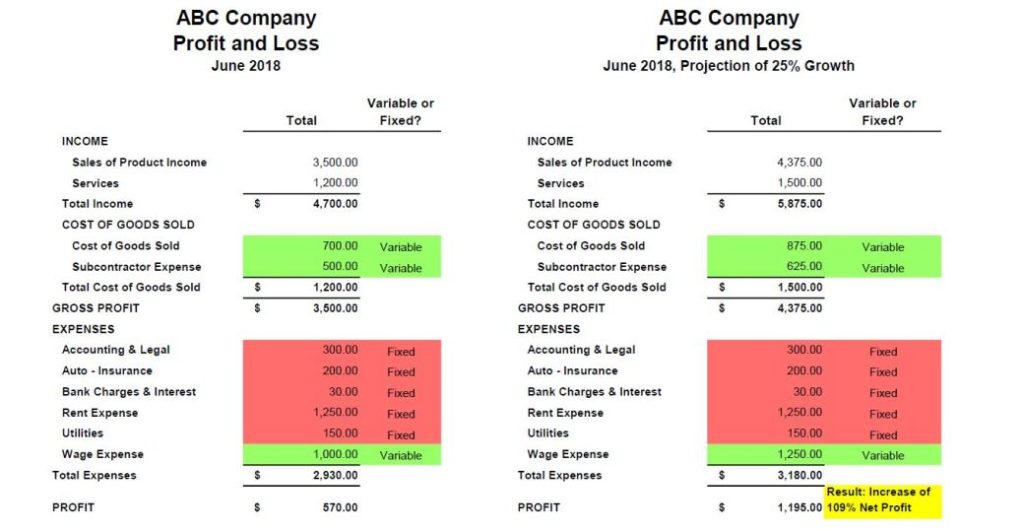
Let’s look at an example. ABC Company has been operating for a couple years and has a decent, but still relatively low, profit. The owner of ABC Company can analyze the Profit and Loss Report by identifying which expenses are Variable or Fixed, and projecting what would happen if the company experienced a 25% growth in Sales. To do this, the owner would multiply Sales and all Variable Expenses by 1.25 and leave the Fixed Expenses alone. This projection shows that a 25% increase in Sales will result in a 109% increase to the Net Profit!
ABC Company is set up for success because the variable costs are representing an appropriate % of Sales. This is calculated as Variable Expenses $2,200 / Total Income $4,700 = 47% of Sales. There are variations in different industries, but ideally your Variable Expenses % of Sales is 50% or lower. ABC Company will be able to make a decent profit if they can increase Sales.
The owner should concentrate their energy on advertising and bringing in new business.
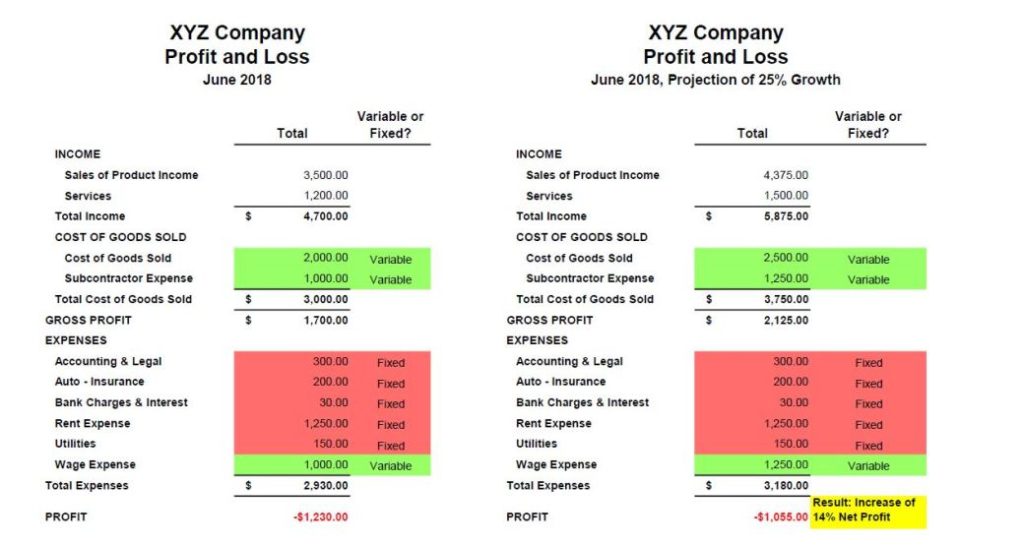
Now, let’s look at an example of XYZ Company, which has the same Sales and Fixed Expenses as ABC company, but is experiencing a loss. The business owner is likely frustrated, perhaps not knowing what the problem is, and thinking that if they can increase Sales, they will be able to finally start making a profit.
By running the same calculation, we get Variable Expenses $4,000 / Total Income $4,700 = 85% of Sales. It will be very difficult for this business to ever make a profit because it has thin margins. This is a term used to describe when the Variable Expenses are high in relation to Sales, and so there is only a thin margin left of profit before the Fixed Expenses are paid. When we run the same projection of 25% Growth, the result is only a 14% increase to Net Profit. If there are no drastic changes, the only way that XYZ Company will ever make a profit is to have a very high volume of sales.
The owner should use this information to make important business decisions such as Re-Pricing Products & Services at a higher level and/or finding cheaper suppliers or materials for the Variable Expenses. It would be beneficial to focus energy on this before pushing to increase Sales.
I hope this information has been helpful! Let me know your favourite ways to filter and analyze your QuickBooks Online Profit & Loss Report in the comments!
NOTE: The financial information represented above is from a SAMPLE company. Deximal takes the confidentiality of our clients’ personal information very seriously and would never share sensitive information with anyone.